
CS@10 Minutes – A deep analysis of NA LCS lane phases and which players rise to the top
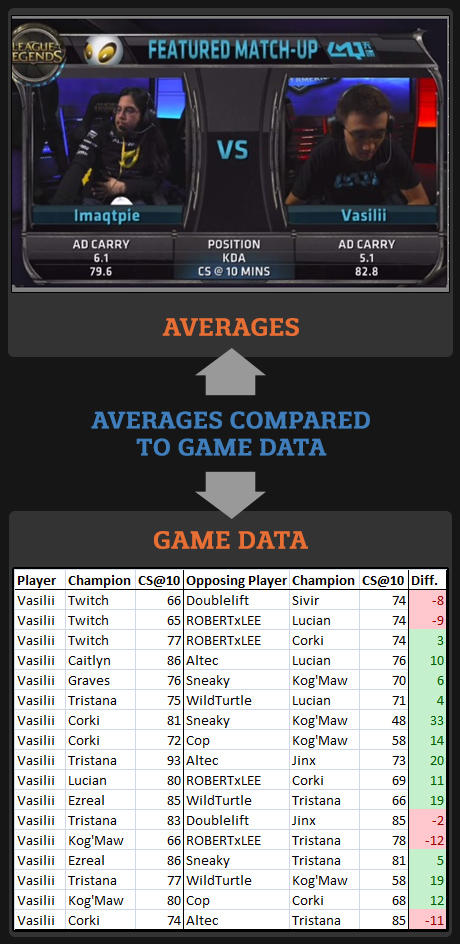
In the search for ways to better evaluate players through statistics, one common suggestion that arises is counting minion kills at 10 minutes (which will be now known as “CS@10”, from the legacy DotA term). Riot has taken to this stat as well using it often in the Summer Split coverage, but I was not always convinced in how they were using it. There are a couple of issues, first being that taking season averages doesn't quite address 2v0/2v1/2v2 lane situations, as some teams do it more than others which influences the CS@10 for particularly top laners. The second problem is that averages can make the difference between players seem small by showing that certain players are only a couple cs better than other players, but that is not true if you look at the game-by-game data, where players often get 10-20 cs leads. Here is an example looking at Vasilii:
In order to address these issues we attempted to break down the CS@10 data in a new and different way. We came up with three presentation/analytics to use on the CS@10 data.
First Presentation - Comparing player averages to opponent averages
The first way we tried to bring context to this stat is by looking not just at their own average CS, but also how much their opponents average to see if maybe some players were better at “denying” farm from other players. This approach also slightly addressed a concern of 2v1 vs 2v0 vs 2v2 lanes, as their opponents face the same situations they do. Here was how the data turned out:

Some interesting things to note is how Westrice has the highest CS @ 10 min of all top laners, but his opponents also average the highest leaving him at a disadvantage that you would not have realized without the context of his opponent. Also, while XiaoWeiXiao has been hyped as the mid laner with impeccable farm, he averages less cs than Bjergsen, but denies his opponents the most which gives him the largest difference. Similarly, while Dyrus has less farm than Westrice he is significantly more farm difference because he ‘denies’ his opponents more.
However, this average-oriented approach has a few flaws. First it doesn’t directly address the lane situations such as 2v1, 2v0, or 2v2. It blurs the line of which is a player “denying” an opponent or just that team playing more 2v1/2v0 situations where top laners get less farm. Also, it makes the stats seem insignificant. As we saw in the first graphic, just because vasilii has a “4.9 difference” minimizes the true dominance of him in lane, as he often gets 15-30 CS leads.
Second Presentation - Comparing player average to expected average based on lane situation.
In attempt to solve the 2v2 issue we broke out the stats based on the lane situations. Here were the general averages of lane cs in each situation.

After finding the averages, we wanted to compare this to players. So we created an “expectation” of player’s CS@10 by weighing how often they were in each of these lane situations. This is created using the averages above for each role then weighing them against their lane situations.
For example, looking at Balls he was in “2v0” 8 times, “2v1” 3 times, and “2v2” 17 times. That equation would turn to be: (37.47*8 + 42.70*3 + 73.71*17)/28 = 60.03. This is below his actual average which means he is an above-average farmer in first 10 min.

This highlights some data that we were missing in the previous presentation. For example we saw Westrice had high farm but the reason was because he had way more 2v2 lanes than other top laners, which gave him a higher expected average (that he didn’t quite meet). Also while we see people like Zionspartan and Seraph average around the same amount of cs, Seraph is actually performing significantly worse because he has had way less 2v0 or 2v1 situations than Zionspartan, and so he is expected to get more farm than Zion is, but he only got 0.1 more.
Third Presentation - Breaking down results on game-by-game basis.
Neither of these first two presentations really represent the big variances on a game-by-game basis though. There is high spread and often there are clear “winners”, rather than simply a 3-4 cs advantage here and there. However, by the reality of averages it blurs these games together to seem like the difference between balls and seraph is only 10 CS.
In order to articulate players more clearly than simply averages I looked at things on a game by game basis and tallied up who had the advantage and by how much. From there I divided up leads into 5 categories: Significant lead (greater than 1.33 standard deviations of the leads/deficits away from 0), Slight lead (between 1.33 and .33 stdevs from 0), Even (between .33 and -.33 stdevs, meaning there was no real lead to be had), Slight deficit (-.33 to -1.33 stdevs), and Strong deficit (less than -1.33 stdevs). This means that the bins of each role is different because of the different standard deviations, for example jungle has less varied CS@10 because they farm less and thus a big CS lead in the jungle is just 10, while a big lead for mid laners would be 20.
For this presentation we will go role by role to look at which players in 2v2 lanes get leads, as well as write up some interesting conclusions from these graphs. One thing I would keep in mind is to look at the percentage of positive vs. percentage of negative, which is an interesting relationship to me.
Top lane:

Conclusions:
Dyrus is a rock top lane with only 1 game where he had a deficit and the most strong leads out of any top laner.
Ackerman was surprisingly weak in farm having a deficit in a majority of his games.
Seraph and Zionspartan are also both underperforming with a lot of games where they were significantly behind and were rarely ahead.
Junglers
Note: I wouldn’t draw “performance” conclusions from jungler stats, as it’s not like the more talented jungler gets the most farm, but rather draw playstyle conclusions like certain junglers farm more or less than others.

Conclusions:
Meteos despite not being as known for his farm style has the most farm by 10 min of junglers often getting significantly ahead.
- Amazing on the the other hand is a surprisingly gank-heavy jungler, often getting out-farmed.
Mid Lane

Conclusions:
The most surprising thing here is pr0lly’s 10 minute dominance. Nobody thinks of pr0lly as a lane-winner, especially compared to the hyped XiaoWeiXiao, but he is in the lead for more games than XWX.
Shiphtur often gets a disadvantage and very rarely gets an advantage, despite the claims that he is one of the most talented rising stars in NA.
HotshotGG in his brief debut didn’t win a lane and actually significantly lost his lane in 2 of his 4 games.
AD Carries
Note: should think of these as “Bot lane” as a Support influences the ADC’s CS.

Conclusions:
Wildturtle has had a really bad year in lane having the largest % of disadvantages of any LCS starter. I looked into the change from Gleeb to Lustboy and in the 5 lustboy 2v2 games he has had 3 slight disadvantages and 2 strong disadvantages, leading to a seed of doubt if this was a good move for TSM.
There have been doubts about Vasilii but this lense makes him look like a strong player as he has gotten strong leads in more games than anyone else.
The other bot lane that looks impressive is Altec whose is looking strong statistically in his rookie split.
Conclusion:
While these three presentations of data are all left open for the audience to interpret their own takes and lean towards whichever they feel makes the most sense to them, I feel like the third one breaking things down on a game by game basis is the best at generating conclusions. In future articles I will deep dive onto specific teams, players, and roles using these stats to draw conclusions such as ‘who it is best to get farm on’ as well as looking at historical data and possibly times other than 10 minutes.
Special thanks to Derek 'Kathix' Adams for helping with the data collection for this article and with Presentation 2.


